Thanks for this, I was hoping someone with more knowledge on probability would come along and do real math instead of my boot legged version of probability.
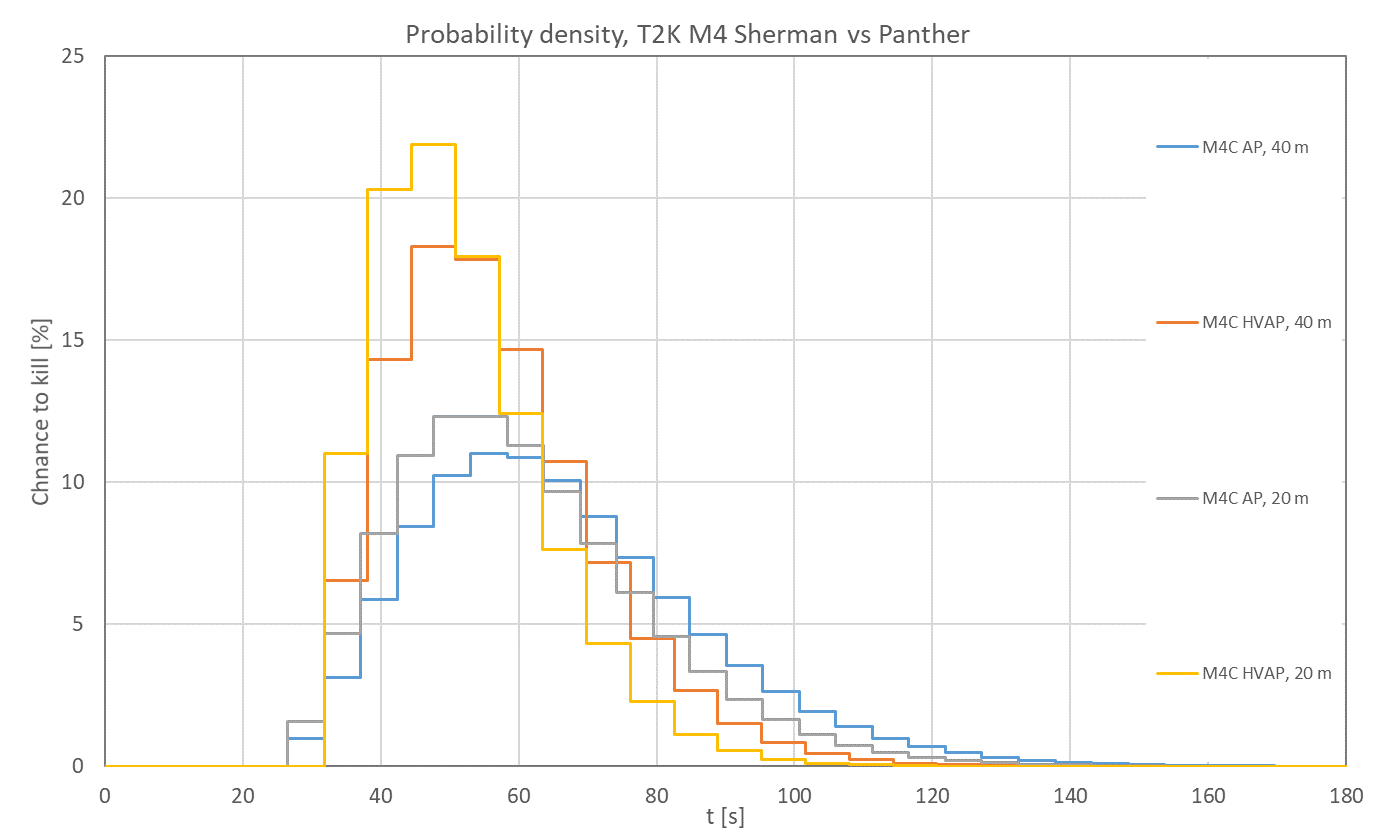
It depicts a different picture in regards to HVAP vs AP but I think one important element missing is there are more 'rolls' on AP than there are on HVAP. Namely that AP will shoots faster which means with every shot, there is a chance for a Panther to die.
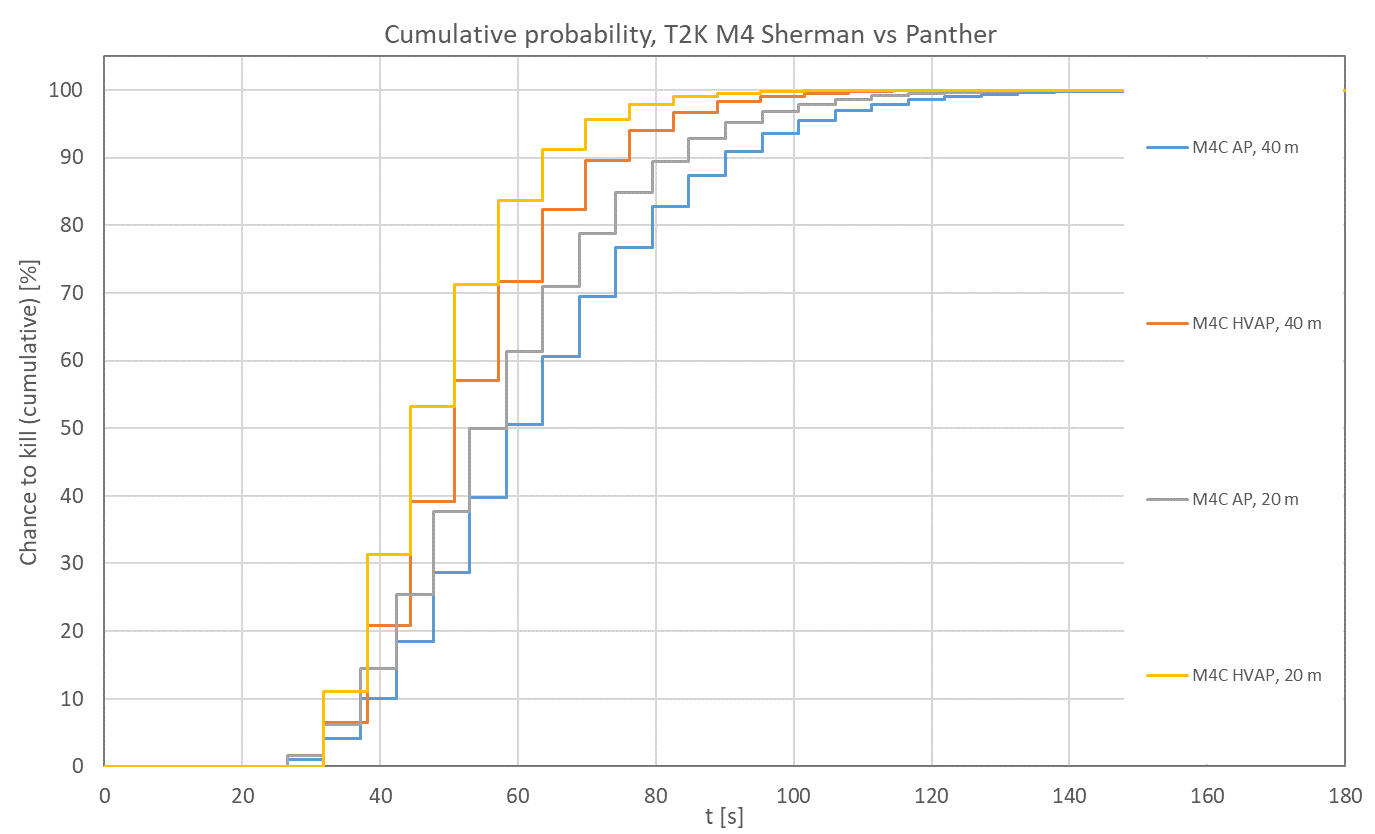
Taking the second chart into account, cumulative probability T2K. If we stop at the 60s mark, AP will have had 6 rolls/chances to kill with each shot while HVAP only has 5. I don't think accuracy can make up that lost chance/gap right? I suppose we can add up all the chances here and average them out and see which one is higher?
Picture:

I think I mentioned in the first post but its hard to calculate the accuracy since the first shot would likely be a moving shot as well. Assuming all shots hit, HVAP doesn't seem much better. Especially with the 6s switch time.
I guess it would be a good idea to clarify the 2nd graph a bit more and what these probabilities imply. Basically there are two ways to read the info in there.
1) If you look at a certain timestamp, e.g. the 60 second mark as in your example, the y-value of the curves will tell you the probability the M4C will have killed the Panther (i.e. out of all shots fired 6 penetrating hits have been scored) within 60 s or less. In this case, the AP Sherman at 40 m (blue line) will have a kill probability of a bit over 50%, while the HVAP Sherman (red line) will have killed the Panther in over 70% of all cases. Hence, the HVAP Sherman is more likely to knock out its target within 60 s.
2) If you pick a certain percentage on the y-axis, the respective value on the x-axis will tell you the average time it takes to kill the Panther with that confidence. If we, for example, pick a success probability of 50% the AP Sherman will need at least ~58 s to kill the Panther in 50 out of 100 cases, while the HVAP Sherman only needs around 51 s to do the same. If you increase the confidence level even more to 75% (i.e. out of 100 tries, the Panther is killed at least 75 times) the gap between the time it takes both tanks on average to knock out the target in at least 3/4 of all cases increases even more.
Note that these graphs already factor in ROF, not only penetration, so the extra round fired by the AP Sherman after ~7 firing cycles is already part of the equation (the horizontal gaps between the jumps in the graph are slightly shorter for the AP Sherman).
Ideally, the difference in accuracy should of course also be considered. But since this is (with my limited understanding of math at least) hard to implement into the probability calculation I used we'll have to treat this as an additional layer of RNG on top. And that's not even considering scatter shots which are even harder to compute deterministically.
However, the HVAP Sherman is vastly superior at all ranges here, so it should perform even better comparatively in an in-game head-to-head matchup than these graphs suggest.


 cblanco ★
  보드카 중대
  VonManteuffel
  Heartless Jäger