Login

russian armor

Resource income per game mode

6 May 2017, 17:32 PM
#1
avatar of Siphon X.
Senior Editor Badge

Posts: 1138 | Subs: 2

So, this is resulting from a request by vipper and I thought this might be of general interest.

What I did here was to create some graphs which show the resource income for each game mode per time.

To explain a little bit about where the data comes from:


What the graphs show is the average fuel, manpower and CP income after a match ended in a specific game mode, binned in 3 minute windows. The statistic was derived from all automatch game that I found since the start of 2017. For a total of about 280k, 356k, 202k and 340k games for 1v1, 2v2, 3v3 and 4v4, respectively.

Let's start with command points:


As we can see it seems like CPs increase more quickly the less players are involved. The difference between 1v1 and 4v4 is about 3 minutes. Now, some notes on this:

  • The CPs should be capped at 32 so I would have expected that within 60 minutes each player would have reached that point. Now, seems like that that is not happening in 3v3 and 4v4 (at least on average). I looked into this a bit more, and found that occasionally the cpearn value is actually higher than the theoretical maximum 32. So, occasionally there seem to be a few hiccups either in the client or on the server side. That said, this happens rarely and probably hasn't much influence here.

    What I guess is that in the higher gamemodes occasionally poor players that are near AFK and thus do not accumulate a lot of CPs are carried by stronger players (or you have one of those on either side). So, since the maximum is capped at 32 it means that the average is lower in this cases.

    This does not happen as often in the smaller gamemodes because if e.g. in 1v1 a player is AFK, the game will surely end before reaching 60 minutes!

  • Furthermore, the average of CPs for 4v4 is 0 even after 9 minutes (likewise the average for all other gamemodes is unexpectedly low. That surely can't be correct, right? Well, I guess the "problem" here is that games that end before 9 minutes probably do so because one or more players are basically AFK. So the values at very early times are not expected to be very representative for how many CPs the average player will have by - say - 9 minutes.


Next comes fuel:
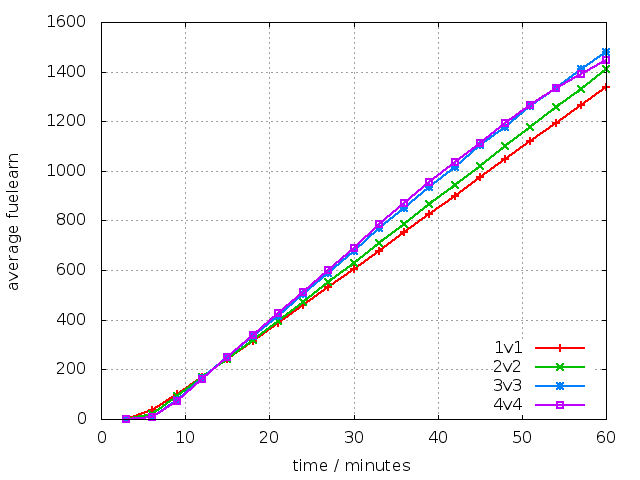


What we can see here is that in 3v3 and 4v4 the fuel income indeed is higher than for 1v1 and 2v2. This is expected to the typically slightly higher number of resource points on larger maps and the prevalence of caches in these game modes.

That said, the difference between 1v1 and 4v4 is smaller than I expected (around 200 fuel after 60 minutes). Also, it is noteworthy that before about 14 minutes the fuel incomes is slightly lower in the larger game modes.

This is partially probably due to the longer distances that need to be covered, but surely also subject to the "players are AFK effect" described in the CP discussion. That said, I expect the effect here to be smaller. The reason is that an AFK player does not only earn no CP but he also keeps the opposing players from earning many CPs. In terms of fuel, however, the AFK player might not actually cap for his team but he makes it easier for the other team to cap points.

And for the later stages of the game it shouldn't make a difference because all point will be captured, if not by the team with the near AFK player then by the other team.

Finally manpower (which is basically is the inverse measure of how many units the players have on the field):


Here, the higher the gamemode, the less manpower was earned. This would mean that on average there are higher casualties the smaller the gamemode. No idea what I expected here... This might have to do with players tending to have more units idling around, camping or simply not being very aggressive (see the points above on players being carried); that said, a player that is so AFK that he even fails to build units would push the curve up, so...

Edit:
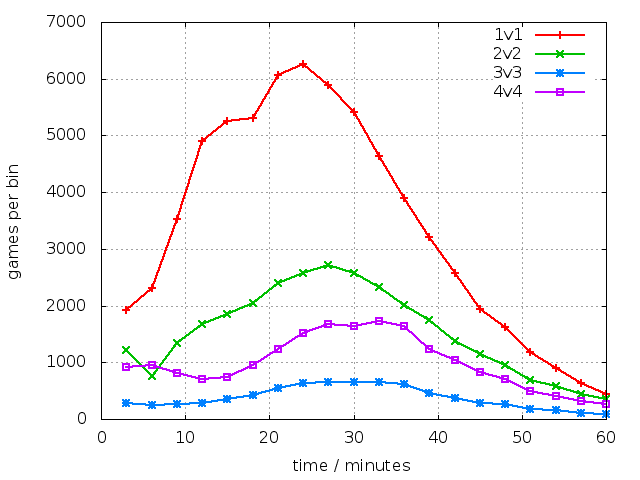
Ok, after the discussions below, I added a criterion that only games are included in which all players are at least level 10. This restricted the number of games considerably (about a tenth is left). This did help a little bit, but the CP curves for the late games in 4v4 still looked a bit wonky. Then I realized that there are not that many games that last 60 minutes, so it's probably simply not worthwhile looking at the end there (I just happen to like asymptotical behavior as sanity check. Sigh...).

This is how many games there are left for each 3 minute bin:


CPs:


The rest also contain X per minute plot.

Fuel:


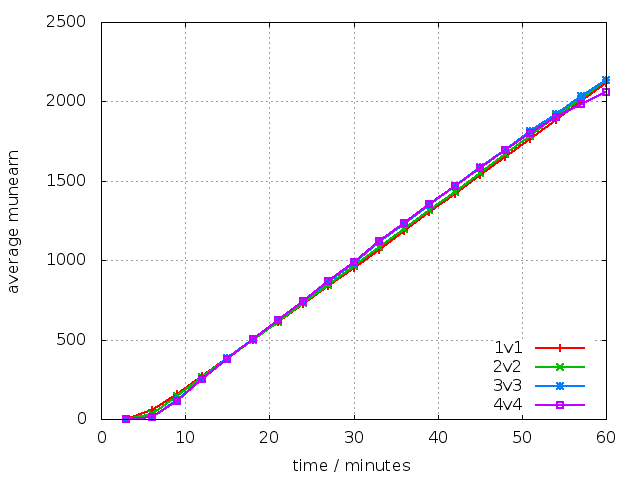
Munitions:


Manpower:


6 May 2017, 18:21 PM
#2
avatar of A table

Posts: 249

Is there a graph about Ammo income?
6 May 2017, 18:44 PM
#3
avatar of Siphon X.
Senior Editor Badge

Posts: 1138 | Subs: 2

Is there a graph about Ammo income?


Here you go:

6 May 2017, 18:44 PM
#4
avatar of scratchedpaintjob
Donator 11

Posts: 1021 | Subs: 1

some nice graphs, but if you have the time plotting the income is probably also very interesting.
also as you say the numbers seem to be disturbed by the massive amount of AFKers, therefore getting the data from top level 4v4 (if that even exists) would probably be very interesting. i would expect an even larger difference in income of fuel due to massed caches
6 May 2017, 18:55 PM
#5
avatar of elchino7
Senior Moderator Badge

Posts: 8154 | Subs: 2

some nice graphs, but if you have the time plotting the income is probably also very interesting.
also as you say the numbers seem to be disturbed by the massive amount of AFKers, therefore getting the data from top level 4v4 (if that even exists) would probably be very interesting. i would expect an even larger difference in income of fuel due to massed caches


Also something people should note, is that it's not the same 20f early on than 30+mins into the game. Simil with ammunition.

IMO you wouldn't need to crop out too much to make it worthwhile. If you make it something like top1000 it should be enough to filter those kinds of players i guess?

PD: damn that amount of afk is really scary.
6 May 2017, 18:57 PM
#6
avatar of ferwiner
Donator 11

Posts: 2885

The problem is that the higher is the "top" cap, the smaller amount of data and so higher uncertainty.
6 May 2017, 19:08 PM
#7
avatar of elchino7
Senior Moderator Badge

Posts: 8154 | Subs: 2

The problem is that the higher is the "top" cap, the smaller amount of data and so higher uncertainty.


1v1: there's around +2000 ranked players per faction
2v2: around +2500 faction/teams
3v3: around -1500 teams and ±3500 randoms per faction
4v4: around 500 teams and ±6000 randoms p. faction

After looking at the amount of people ranked, cutting down at top1000 is pretty forgiving.
6 May 2017, 19:11 PM
#8
avatar of Siphon X.
Senior Editor Badge

Posts: 1138 | Subs: 2

some nice graphs, but if you have the time plotting the income is probably also very interesting.


You mean like the "+23" fuel per minute? That's not in there (it wouldn't even be in the replay files, really).

Not sure what to do about the AFKers. Yes, I could filter by ranks (although that is kind of awkward and adds the additional problem of deciding which players to pick (per AT and RT). Maybe reject all games where the CP difference is higher than - say - 2 from the best to the weakest?

That said, it shouldn't effect the fuel/mun income past a certain point as all points WILL be taken by either team.
6 May 2017, 21:57 PM
#9
avatar of scratchedpaintjob
Donator 11

Posts: 1021 | Subs: 1


You mean like the "+23" fuel per minute? That's not in there (it wouldn't even be in the replay files, really).
Yes, i mean that and yes, it is there, just hidden :D its the slope of the curve you plotted, easy way to do that would be to plot the difference between each data point and the next point (and scale that to minutes)

That said, it shouldn't effect the fuel/mun income past a certain point as all points WILL be taken by either team.

yes, but it would mean less caches. thats why im also interested in a comparison between low and higher level 4v4 to see the amount of caches built
6 May 2017, 22:15 PM
#10
avatar of Siphon X.
Senior Editor Badge

Posts: 1138 | Subs: 2

Yes, i mean that and yes, it is there, just hidden :D its the slope of the curve you plotted, easy way to do that would be to plot the difference between each data point and the next point (and scale that to minutes)
yes, but it would mean less caches. thats why im also interested in a comparison between low and higher level 4v4 to see the amount of caches built


Right, the first derivative should be something similar (it's kind of a weird derivative because it's technically looking at differences between different games :P ) But it should do, I agree.

7 May 2017, 10:19 AM
#11
avatar of Siphon X.
Senior Editor Badge

Posts: 1138 | Subs: 2

...


Added to the initial post.
7 May 2017, 10:49 AM
#12
avatar of A table

Posts: 249


Here you go:


Interesting. It remains largely the same from 1v1 to 4v4

Kinda suprising that people dont generally tend to get more ammo income as the time moves on. It is more important than fuel at that stage where fuel is more than abundent enough.
7 May 2017, 12:05 PM
#13
avatar of Vipper

Posts: 13496 | Subs: 1

Imo CP gain across the modes should be looked at. For instance Soviet is a faction that depend allot in doctrinal units and Reaching CP 2 is very important for them.

In large modes not only the Shock value of these infantries is diminishes because their facing greater opposition but also because the hit the field allot later and they have smaller window of opportunity due higher fuel income.

Any attempts to fix the game across the modes (which seems be part of the scope for the next patch) should imo focus allot on the economy and CP (apart from units).

Thank to Siphon X. for the great work he has done.
7 May 2017, 14:36 PM
#14
avatar of ZombiFrancis

Posts: 2742


Interesting. It remains largely the same from 1v1 to 4v4

Kinda suprising that people dont generally tend to get more ammo income as the time moves on. It is more important than fuel at that stage where fuel is more than abundent enough.


Not exactly possible to cut off resources in any significant manner in most games and maps.

And even when possible, players tend to prioritize cutting off fuel. Even in those late game stages where VPs are ticking players still often prioritize keeping/denying fuel.
7 May 2017, 15:12 PM
#15
avatar of Siphon X.
Senior Editor Badge

Posts: 1138 | Subs: 2


Interesting. It remains largely the same from 1v1 to 4v4

Kinda suprising that people dont generally tend to get more ammo income as the time moves on. It is more important than fuel at that stage where fuel is more than abundent enough.


Also, I figure that caches are more relevant up to maybe 30 or so minutes. After that they tend to get destroyed by pushes and not necessarily rebuild...
7 May 2017, 16:05 PM
#16
avatar of Vipper

Posts: 13496 | Subs: 1

Imo when ti comes to CP it is more interesting to see the time difference in CP level for key call in units for each faction like:
CP 2 for Soviet for elite infantry
CP 8 for UKF for land matress
CP 9/10 for USF for Pries/Calliope
CP 11 for OKW for CP
CP 13/14 for EFA USF for Super heavies
7 May 2017, 17:14 PM
#17
avatar of scratchedpaintjob
Donator 11

Posts: 1021 | Subs: 1

the fuel income plot is very interesting, thanks a lot for that!

4v4 players basically earn 40% more fuel with all caches up than the average 1v1 player
1 user is browsing this thread: 1 guest

Ladders Top 10

  • #
    Steam Alias
    W
    L
    %
    Streak
Data provided by Relic Relic Entertainment

Replay highlight

VS
  • U.S. Forces flag cblanco ★
  • The British Forces flag 보드카 중대
  • Oberkommando West flag VonManteuffel
  • Ostheer flag Heartless Jäger
uploaded by XXxxHeartlessxxXX

Board Info

1070 users are online: 1070 guests
0 post in the last 24h
12 posts in the last week
26 posts in the last month
Registered members: 49991
Welcome our newest member, JoinToYakt
Most online: 2043 users on 29 Oct 2023, 01:04 AM