coh2chart and Its Worth
(Layman)
(Layman)
In this article, COH2.ORG statistics experts and strategists take a closer look at the popular site by Paid_Player which is frequently used as the cornerstone of arguments for perceived imbalances. We dissect whether the statistics are an accurate indicator of current state of the balance.
| ?To start off, how does coh2chart.com work exactly? |
| !Since the latest iteration Relic is providing the data directly, so Paid_Player has to trust them that the data are what they say they are. When listing "games" it's actually "players in a game". For example, one 4v4 game will count as 8 "games" in total. The ranks are determined at the start of the match. The result is that a game that brings a player into the top 250 does not count as "1-250" game, while one where the player loses and is kicked out will count as "loss" there, which biases the resulting percentages to lower values. The resulting values give an accurate depiction of what winrates players in the different rank ranges and games modes experienced in the previous weeks. |
| ?Can the winrates on the coh2chart.com used as an accurate gauge of current state of the balance? |
| !No. |
| ?So what are some things that make the numbers unreliable for that purpose? |
| !The main issue is that matchmaking is trying to produce even matchups between players, negating any faction imbalances which the statistics is trying to capture. This typically fails at both ends of the ladder as a better or worse player - necessary to counter different faction power levels - are not available. As a result, the win percentages there are related to but at best give a distorted picture of the underlying balance. Away from the edges, the win percentages would mostly reflect how well matchmaking is working, not really faction balance. The transition from the edge to the matchmaking-dominated domain is a continuous process and likely happens at different rank levels for the different ladders, further complicating inter-faction comparisons. On top of that, abrupt changes in a faction balance result in temporary bumps in win percentages until the ELO values are adjusted for most players, which can be a slow process. Further, the site does not show faction match up information. Each faction performs very differently depending on which faction it is up against. |
| ?I understand how those things might create unreliable numbers but since they happen to players of all factions, won't the relative win rates between the factions make a good indication of current state of the balance? What I am asking is that do those factors skew the stats in a biased way? |
| !Yes, the factors mentioned above can and do definitely skew the stats in a biased way, as factions apparently are not equally popular across all skill levels even when averaged over far longer time spans. Also, there are more maps in 3v3+ map pool that are favourable to Allies than to Axis. So the 3v3+ win rates will be biased for Allies in this sense. Another example: If you check out the current coh2chart.com(13-07-2016) you see that in the 1-250/1v1 ranking about 4500 games where played on allied side and 3000 on axis side. Now, assuming factions are perfectly balanced: In the ideal case the 3000 axis players would be matched with 3000 allies in the top 250 and get the 50% win percentage. However, the other 1500 allied players would have to be matched with axis players >rank 250 and in those games they will likely win more than 50% of the games, so overall the allied win percentage will turn out to be higher.
|
| ?Is there any other factor that might skew the numbers? |
| !One more thing would be the the cases of really good players playing the game with one faction for however long period of time. For example, if Luvnest decides focus on UKF for one week, the data that came from the week will be biased for UKF. This might be a main source of the rapid variations observed on coh2chart of about +/- 3% even when no significant patch was applied. Still, player preferences can induce long term biases that are not as obvious. |
| ?How can we benefit from coh2chart.com? |
!Although the win rate numbers themselves are not overly suitable as basis for a balance discussion, we can use the win rate versus date graph to get a sense of the balance trend. For example, OKW and Ostheer win rates have been going down drastically. While this does not necessarily mean that Allies are overpowered, the downward trend does prove that the patch has been more favourable for the Allies for now. This alone is a useful information. But this alone does not prove imbalance. On top of the factors we mentioned above, players just might need more time to adapt. In order to truly gauge the state of the balance, we need to go deeper.
|
| ?So what methods would be best to measure the state of the balance? |
| !We would recommend data from tournaments where only good maps and top players are matched off against each other. When there are no tournaments, using many of the rpleays and casts between top players is very useful, too. Of course personal experience is also important but one must be very careful to see whether perceived imbalance is due to legitimate imbalance or just a #adapt problem. An excellent 2v2 game. |
| ?Thanks for your insight and hope to see you in game! |
coh2chart and Its Worth
(Siphon X.'s Treatment)
(Siphon X.'s Treatment)
If we trust Relic's data, the numbers in coh2chart are an accurate description of what win percentage players in the different rank ranges achieved.
It can be used to predict how win rates would be in the next week or for a new player, but checking the curves you can see that there are fluctuations even when no patch was applied. Eyeballing the standard deviations, I'd say that for predictions the values are accurate to about 2-3%. So, complaining about balance just because SOV last week had a 2% higher win percentage is pretty pointless.
Balance from the ladder
I guess we agree that the ideal way of getting balance would be to clone e.g. Jove and let him play 10k games against himself. Unfortunately, that's not possible so we have to derive statistics from a larger group; assuming that we have two factions and six players (A-F, with "A" being the most skilled), we'd hope that the matchups would look like this:

Assuming that the balance is 60% in favor of OKW, regardless of skill, each of these matchups should result in the OKW players winning in 60% (arrows pointing from the winner to the loser), so if the sample size is just big enough, we should get that 60:40. Problem is, this is not how this works in automatch due to the matchmaking. The matchmaking will try to arrange the matchups so that matches might look like this:

All OKW players are matched up with more skilled SOV player to achieve a 50% win percentage. Obviously the A player of OKW and F of SOV don't have a partner, so, A might get a lower skilled SOV player and F a higher skilled OKW player, or they even might be directly linked like in the diagram.
So, the overall winrate of OKW now is still higher than that of SOV, but not actually because equally skilled players are matched, but because there are some mismatches.
The resulting win percentages from coh2chart would look like this:
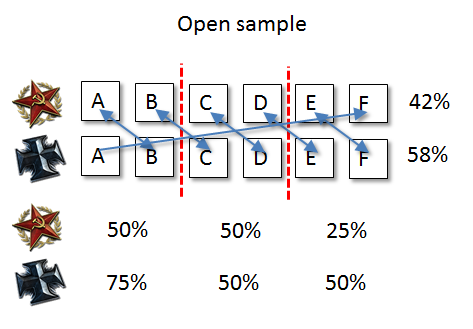
The broken red lines indicate the different rank ranges. Now, the central range actually shows a 50:50 chance, only the top and bottom bracket indicate the imbalance. But at least OKW comes out first. Now, one criticism of coh2chart is that it uses open samples, like, the statistics contain matches between different rank brackets.
Let's see what we obtain when using only matches within the brackets:
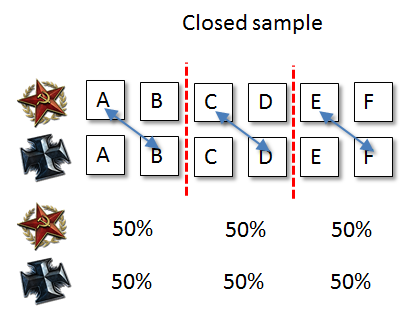
Dang, now all win percentages are 50:50.
Clearly, the matchmaking will never work like this. Let's assume that additionally at times players might be matched like in the first diagram. However, if players keep winning more, eventually they would be matched with harder opponents, which would be like the "restoring force". So, we might end up with these three sets of matchups (in reality there will be way more of course):
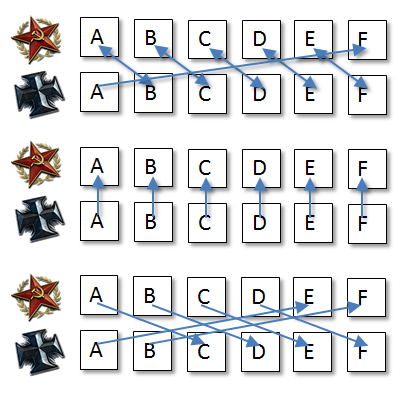
What would those give us in coh2chart? The diagram on the left-hand side below shows that there is no real difference to how this looked before. However, the closed sample, shown on the right-hand side, finally works:
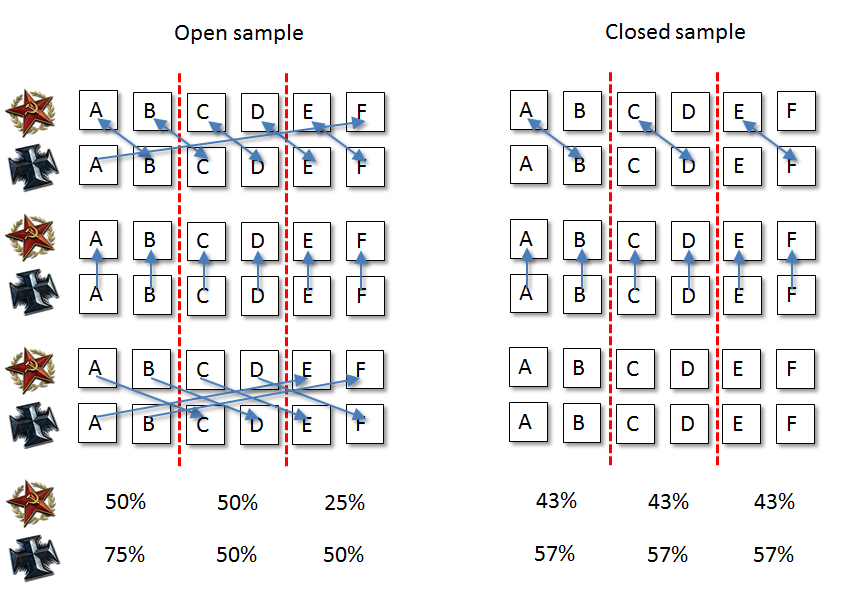
Yay! The effect of adding the other matchups is overstated here, because the third row that counters the second row to some extend requires a shift wider then the brackets are. The discrepancies between the percentages would be much weaker if there are three or more players per bracket.
Let's look at what happens when one player decides to play more often. In the diagram below that's the SOV-B, marked in red. Obviously, he can only play if at least one of the OKW players more games as well. So, the numbers below assume that there are three additional games, one against each of the green players:
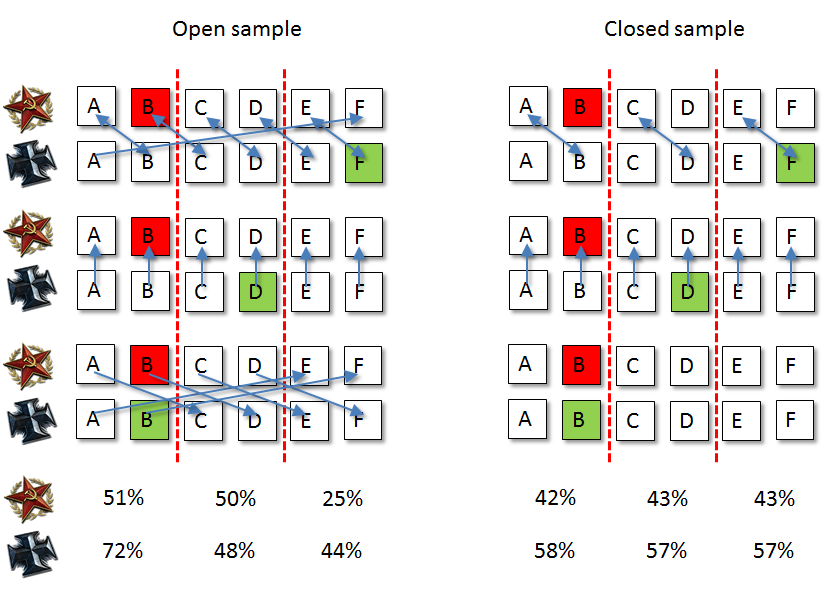
We can see that the open estimate for SOV(top) goes up, which is expected because a better SOV player is playing more often. Eventually, the win percentage for SOV might exceed that for OKW.
The closed estimate, however, is unaffected for the lower brackets but gets closer to the true value, because there is one additional matchup between the two Bs. However, this only works nicely because B is the worse of the two players in the top bracket. If SOV-A would play more, win percentage would get close to 50% for both factions.
Next thing is, now OKW player B stops playing at all. So, he is not available for matchups anymore, but also player C is now member of the top bracket for OKW.
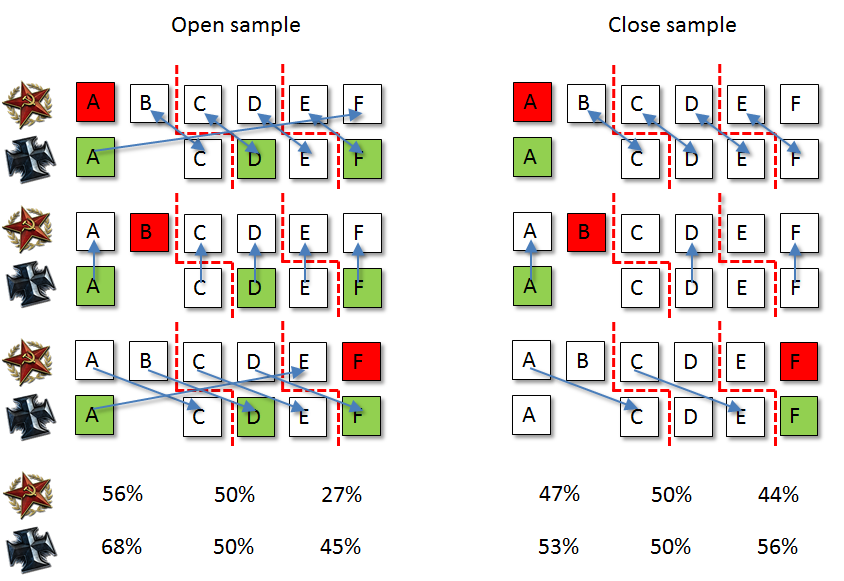
For the numbers, I assumed that each of the standard matchups are happening thrice. However, since OKW-B is missing, one SOV player in each row has no partner (marked red). The percentages are computed assuming that the red player would additionally play once against each of the OKW players marked green.
Again, the percentages for the top bracket drop, because a better OKW player doesn't play anymore. The impact is particularly significant for the closed sample, because suddenly matches from the third row are included in the statistics, in which SOV have the upper hand due to the skill gap. Again, if the discrepancy would be stronger (like, OKW-A quitting instead, or OKW-C quitting as well) win percentages can be reversed and numbers might erroneously indicate that SOV has the upper hand.
So, in conclusion:
- Differences in win percentages happen because matchmaking fails to find even matchups, not really because factions are not balanced.
- That said, imbalance leads to cases where matchmaking is not able to find a proper opponent. So, for the first and last bracket, balance indirectly affects the resulting win percentage in the expected way.
- Percentages will be skewed, depending on if stronger or weaker players play a certain faction more often.
- The open sample that coh2chart provides is not perfect, but closed samples have issues as well, as they rely on knowing the skill of the players in order to determine when to discard matchups.
The 250-500 bracket
As shown in the previous section, this bracket gives merely information about matchmaking, not balance.
Now, assuming a patch hits that changes the faction balance, will that have an effect on the charts? Hell, yes! Assuming that one faction gets nerfed, it means that the ELOs for that faction now are too high. Win percentages for will drop initially. However, eventually it should be close to 50% again ("eventually" might take quite some time as players might chose to play only sparingly, so this might take some months).
Also, since we have five factions, nerfing one faction will have complex interactions with other factions: The nerfed faction will initially loose, at least temporarily boosting the ELO of the opposing factions, which in turn has implications in matchup vs. other factions...
When significantly low win percentages means that a faction was nerfed, does it mean it's UP now? Not really. It means that temporarily the ELOs of its players is too high compared with the relative power of the faction. If it is UP or OP now depends on how it performed previously.
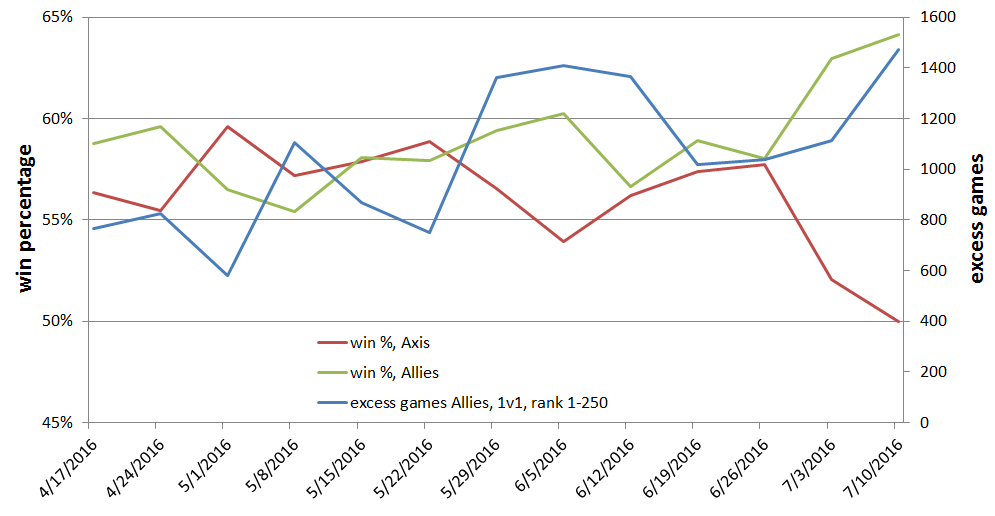
Example from the week 26th June to 3rd July, 2016
I retrieved the data from the ladder, once of twice a day for that week. From that I can add up how often the players played a faction and won. I think this is how originally Paid_Player computed the percentages. A comparison to coh2chart for ranks 1-250 looks like this:
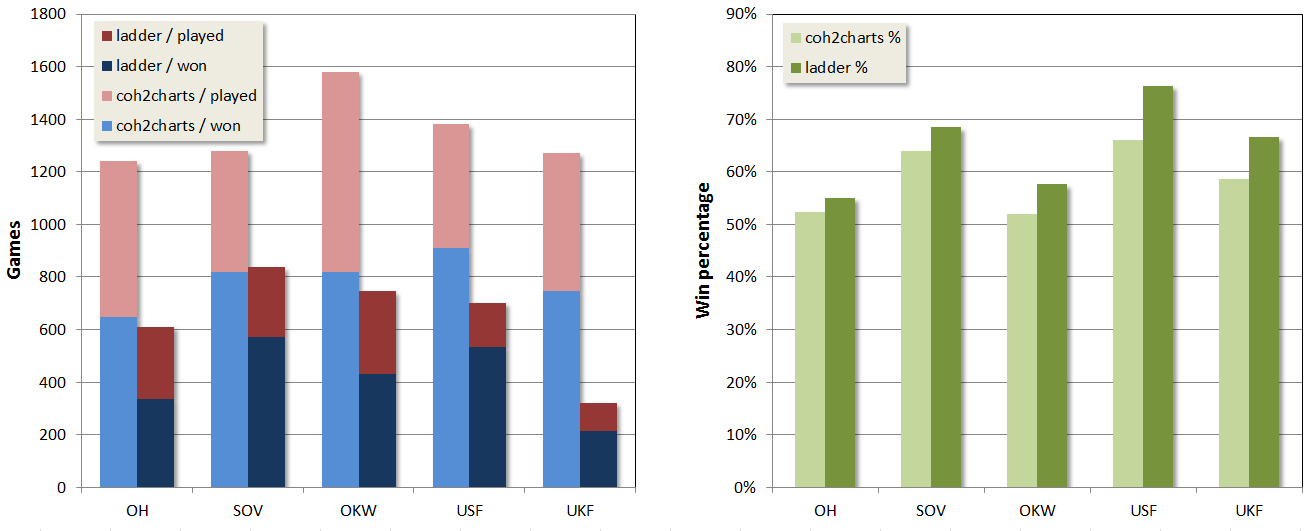
Obviously, the number of games per faction on coh2chart is MUCH larger than what you would gather from the ladder. Now, the only way I can explain this (unless Relic screws up somewhere) is that a player plays a couple of games, gets into the top 250 (this game is not counted in coh2chart), plays a few games in there but finally leaves the top 250 again. And that before I pull the new data from the server about 12h later.
While that definitely happens to some extent, but I really find it hard to believe that that makes for 50% of the counted games. If somebody has another idea, please enlighten me.
At least the win percentages turn out to be rather similar in their structure. The values computed from the ladder are somewhat higher, but that is consistent with the observations above, as the "missing" player would more or less add a lot of games with roundabout 50% win percentage to those games counted from the ladder.
With the ladder data, we can check out how the games are distributed across ranks:

"Beyond" are the ghost players, computed from the discrepancy of the two statistics. You can see that in particular for SOV and OKW higher ranking players contributed much more. For UKF, players that consistently stayed in the top 250 contributed only over 30% of the games.
The next diagram shows the win percentages for all faction, computed for the rank brackets:
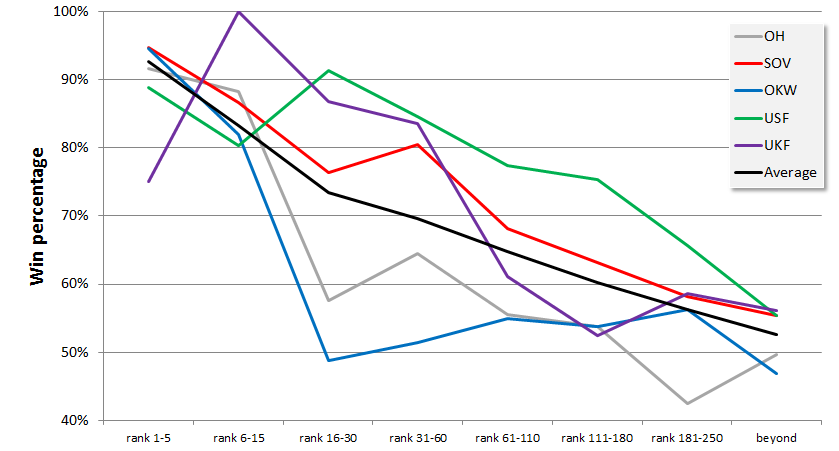
Win percentages are fairly close up to rank 15; beyond that, OH and OKW crash. I didn't include error bars, so note that in particular the sample sizes for USF and UKF for the highest to rank ranges are fairly small.
Anyways, the diagram shows that there is a strong discrepancy in win percentages over all players that are included in the rank 1-250 statistics. This will always pose an issue when trying to derive any kind of statistics.
Since the number of top players is still small, how much of an effect do we expect by that? Well, considering that we have about 1500 games for each faction: If Jove suddenly decides to play about 16 games of OH, which he will likely all win, OH's win percentage suddenly is 1% higher and that of the opposing factions a total of 1% lower. 15 sounds like a lot? Paul.a.D. played 54 UKF games last week and not many with any other faction.
This is just for one week, can we expect those discrepancies to average out when we look at longer time scales? Not really. We can check on this diagram from [http=https://www.coh2.org/news/54445/the-ladder-1v1-matchmaking]my previous post[/http], which shows faction preference vs. ladder percentage (relevant range here is up to about 8% for OH and about 16% for UKF), averaged over about a month:
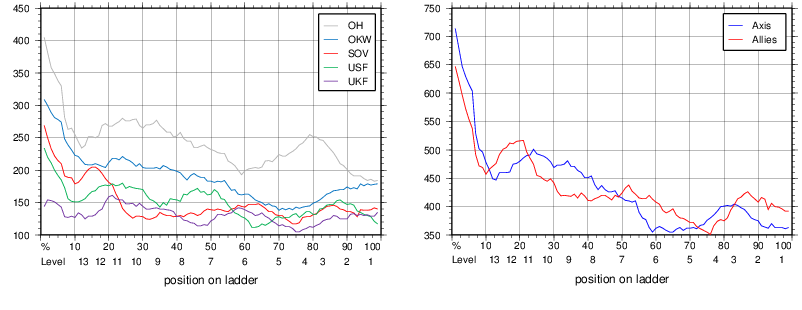
So the results will be biased.
Another problem is that we have different domains: The top where balance matters (as explained in the previous section) and then a matchmaking determined midfield, where balance changes temporarily induce (probably significant) bumps which eventually should even out once the ELOs are adjusted.
The issue is that there is likely a gradual transition from one domain to the other and that transitioning will happen at different ranks for each faction. Like, rank 250 for UKF is probably already past that zone, while rank 250 for OH might be somewhere in the middle. As a result their effects on rank 1-250 will be different for each of the factions.
So, my own personal conclusions about the usefulness of coh2chart are:
- The values on coh2chart.com are affected by balance, but the "real" win percentages appear distorted due to matchmaking and the way the win percentages are computed.
- Strong changes in balance might have considerable temporary effects, which are expected as long as ELOs and the meta has adjusted to the new environment. So, one should wait a some time after those changes to draw conclusions from the numbers.
- The values should be taken with a grain of salt, as they will be skewed e.g. due to discrepancies in player skill.
- Differences between factions of maybe up to 5% are not significant enough given all those dependencies.
- Looking at charts for ranks>250 is probably not worthwhile, at least not for any balance discussion
While I agree that tournaments are better for gauging state of the balance, the problem there is that you still will have matchups of players with significant skill gaps and the sample size typically will be small, so statistics will probably be not overly reliable.




 cblanco ★
  보드카 중대
  VonManteuffel
  Heartless Jäger